pygmt.Figure.grdview
-
Figure.grdview(grid, **kwargs)¶ Create 3-D perspective image or surface mesh from a grid.
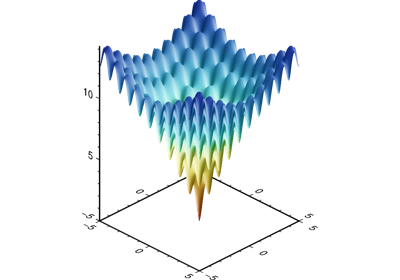
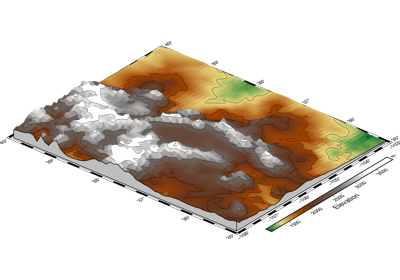
Reads a 2-D grid file and produces a 3-D perspective plot by drawing a mesh, painting a colored/gray-shaded surface made up of polygons, or by scanline conversion of these polygons to a raster image. Options include draping a data set on top of a surface, plotting of contours on top of the surface, and apply artificial illumination based on intensities provided in a separate grid file.
Full option list at https://docs.generic-mapping-tools.org/latest/grdview.html
Aliases:
B = frame
C = cmap
G = drapegrid
I = shading
J = projection
JZ = zsize
Jz = zscale
N = plane
Q = surftype
R = region
V = verbose
Wc = contourpen
Wf = facadepen
Wm = meshpen
X = xshift
Y = yshift
c = panel
p = perspective
t = transparency
- Parameters
grid (str or xarray.DataArray) – The file name of the input relief grid or the grid loaded as a DataArray.
zscale/zsize (float or str) – Set z-axis scaling or z-axis size.
frame (str or list) – Set map boundary frame and axes attributes.
cmap (str) – The name of the color palette table to use.
drapegrid (str or xarray.DataArray) – The file name or a DataArray of the image grid to be draped on top of the relief provided by grid. [Default determines colors from grid]. Note that -Jz and -N always refers to the grid. The drapegrid only provides the information pertaining to colors, which (if drapegrid is a grid) will be looked-up via the CPT (see -C).
plane (float or str) –
level[+gfill]. Draws a plane at this z-level. If the optional color is provided via the +g modifier, and the projection is not oblique, the frontal facade between the plane and the data perimeter is colored.surftype (str) – Specifies cover type of the grid. Select one of following settings: 1. ‘m’ for mesh plot [Default]. 2. ‘mx’ or ‘my’ for waterfall plots (row or column profiles). 3. ‘s’ for surface plot. 4. ‘i’ for image plot. 5. ‘c’. Same as ‘i’ but will make nodes with z = NaN transparent. For any of these choices, you may force a monochrome image by appending the modifier +m.
contourpen (str) – Draw contour lines on top of surface or mesh (not image). Append pen attributes used for the contours.
meshpen (str) – Sets the pen attributes used for the mesh. You must also select -Qm or -Qsm for meshlines to be drawn.
facadepen (str) – Sets the pen attributes used for the facade. You must also select -N for the facade outline to be drawn.
shading (str) – Provide the name of a grid file with intensities in the (-1,+1) range, or a constant intensity to apply everywhere (affects the ambient light). Alternatively, derive an intensity grid from the input data grid reliefgrid via a call to
grdgradient; append+aazimuth,+nargs, and+mambientto specify azimuth, intensity, and ambient arguments for that module, or just give+dto select the default arguments (+a-45+nt1+m0).verbose (str) –
Select verbosity level [Default is w], which modulates the messages written to stderr. Choose among 7 levels of verbosity:
q - Quiet, not even fatal error messages are produced
e - Error messages only
w - Warnings [Default]
t - Timings (report runtimes for time-intensive algorthms);
i - Informational messages (same as “verbose=True”)
c - Compatibility warnings
d - Debugging messages
xshift (str) –
[a|c|f|r][xshift]. Shift plot origin in x-direction.yshift (str) –
[a|c|f|r][yshift]. Shift plot origin in y-direction. Full documentation is at https://docs.generic-mapping-tools.org/latest/gmt.html#xy-full.panel (int or list) – [row,col|index]. Used to advance to the selected subplot panel. Only allowed when in subplot mode. Available to all plot modules. If no arguments are given then we advance to the next panel in the selected order. If no panel is given and we just entered subplot mode then the first panel (top, left) is selected. Instead of row, col you may give the one-dimensional index which depends on the order you set via autolabel when the subplot was defined. Note: row, col, and index all start at 0.
perspective (list or str) –
'[x|y|z]azim[/elev[/zlevel]][+wlon0/lat0[/z0]][+vx0/y0]'. Select perspective view and set the azimuth and elevation angle of the viewpoint. Default is [180, 90]. Full documentation is at https://docs.generic-mapping-tools.org/latest/gmt.html#perspective-full.transparency (float) – Set transparency level, in [0-100] percent range. Default is 0, i.e., opaque. Only visible when PDF or raster format output is selected. Only the PNG format selection adds a transparency layer in the image (for further processing).

